
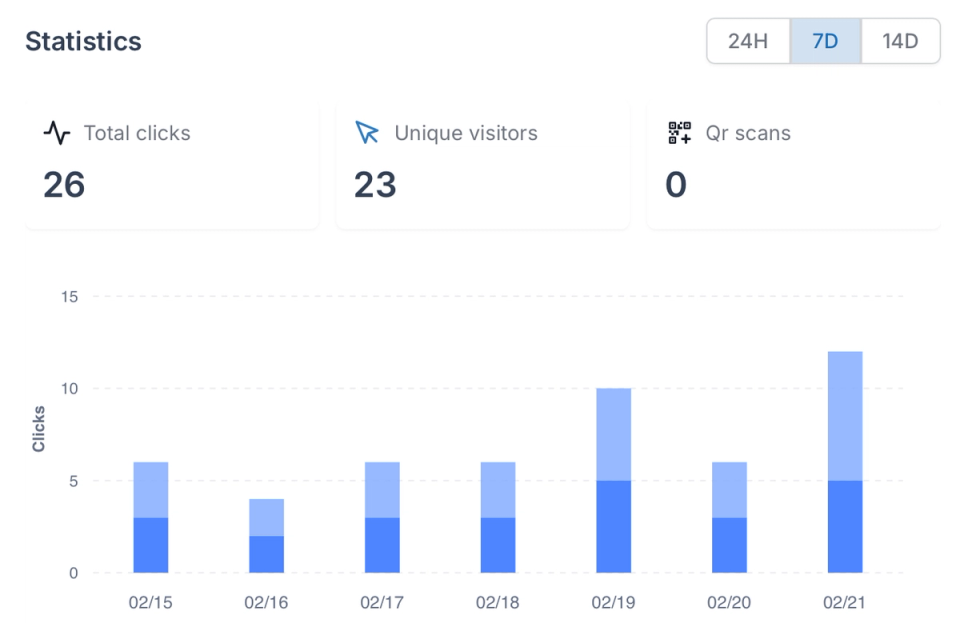
Total clicks, unique visitors, QR scans — everything in one dashboard so you always know what's performing and what's not.
- Total clicks: See total hits per redirect with hourly distribution to spot traffic patterns and spikes as they happen.
- Unique visitors: Separate returning users from first-time visitors to understand true reach, not just raw volume.
- QR scan tracking: Monitor QR code performance separately from URL click-throughs — useful for offline campaigns and print assets.
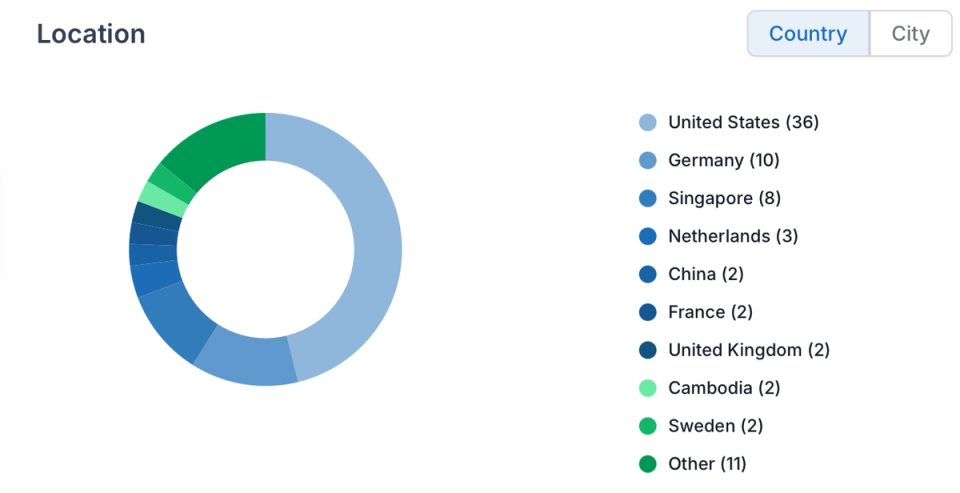
Understand who is clicking your redirects — where they are, what device they are on, and which domain is sending them.
- Geographic breakdown: Country and city-level location data for every redirect — see where your traffic actually originates.
- Device and browser: Mobile vs desktop split, browser breakdown — know how your audience accesses your links.
- Domain-level traffic: Compare traffic across domains and subdomains in one view to see which properties are driving volume.
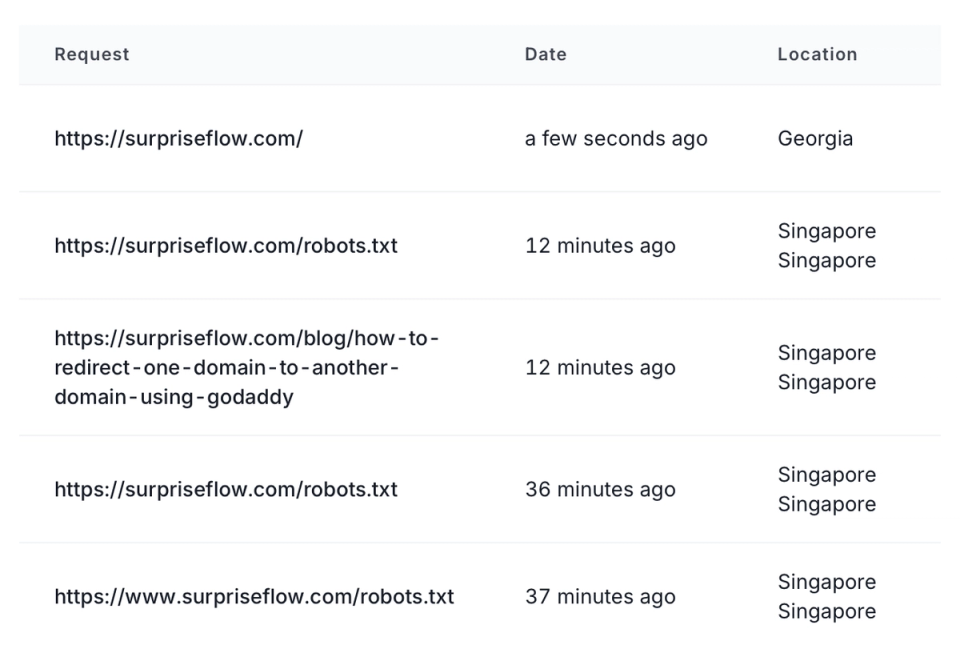
See every visit as it happens. The live log shows timestamps, locations, and device info so you catch anomalies the moment they occur.
- Live activity log: A real-time stream of recent visits with timestamp, location, and device — updated as hits come in.
- Per-redirect detail: Drill into any individual redirect to see its full traffic history, not just aggregate totals.
- Error visibility: Spot redirects generating errors or unusual patterns immediately — before users report them.
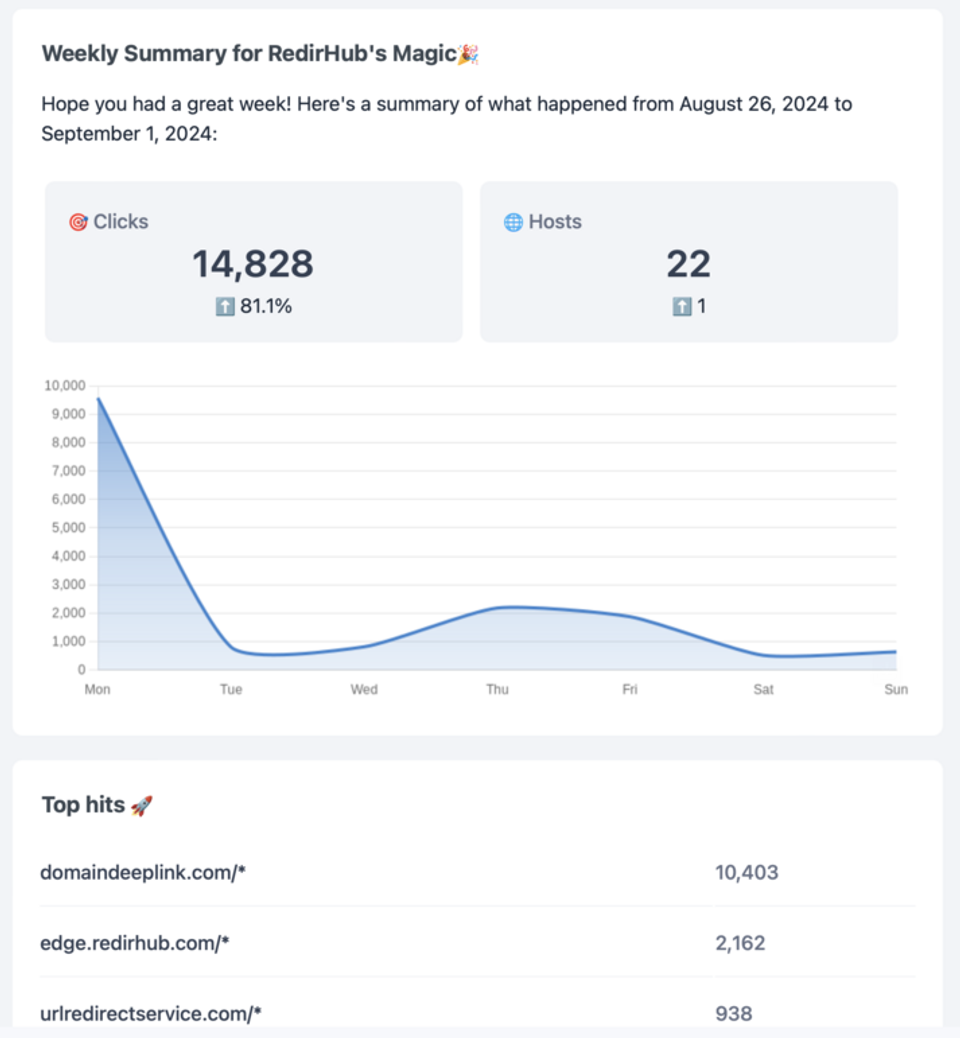
Weekly and monthly performance summaries land in your inbox automatically. No dashboards to check, no exports to schedule.
- Scheduled email reports: Weekly and monthly summaries of your redirect performance delivered directly to your inbox.
- Raw log pipeline: Access full raw traffic logs for deeper analysis in your own BI tools or data warehouse.
- Export on demand: Pull data at any time for client reports, audits, or custom analysis — no access restrictions.
Why Our Customers Love RedirHub

We've used RedirHub for several years and find it excellent. The 'entry level' is FoC and allows users to test the features (free forever) before deciding if to upgrade to a paid service. Technically, it works very well, great support from Kris & his team, and highly recommended.

David
Read more→It works like a charm, redirecting domain names with SSL is a huge pain. I have to do it frequently, often at mass and it was hours of work. Now it is few clicks.

Zsolt Bikadi
Virtua Drug • CSO


Frequently asked questions